Improve JS libraries performance
Our journey to X Components
Performance is a critical focus in web development, especially when integrating a library that needs to be downloaded from an external endpoint with minimal impact on existing webpages. With the latest release of the X Components library, we've reached a significant milestone. Let’s look back on our journey to enhancing performance with X Components.
In web development, balancing functionality, impact, and performance is essential. Tools like Google Lighthouse and Core Web Vitals have become industry standards for measuring various aspects of website performance, including speed, accessibility, best practices, and user interactions.
Our journey began with these tools to evaluate and enhance the performance of X Components. Here’s a look at our key metrics and how X Components stacks up against our previous solution.
Our journey: where we come from and where we are now
Our previous solution functioned similarly to our current X Components, but as the product grew, we needed a more advanced solution. From the start, performance was a key consideration in developing X Components. External libraries can heavily hinder performance, so we needed our solution to be streamlined and lightweight.
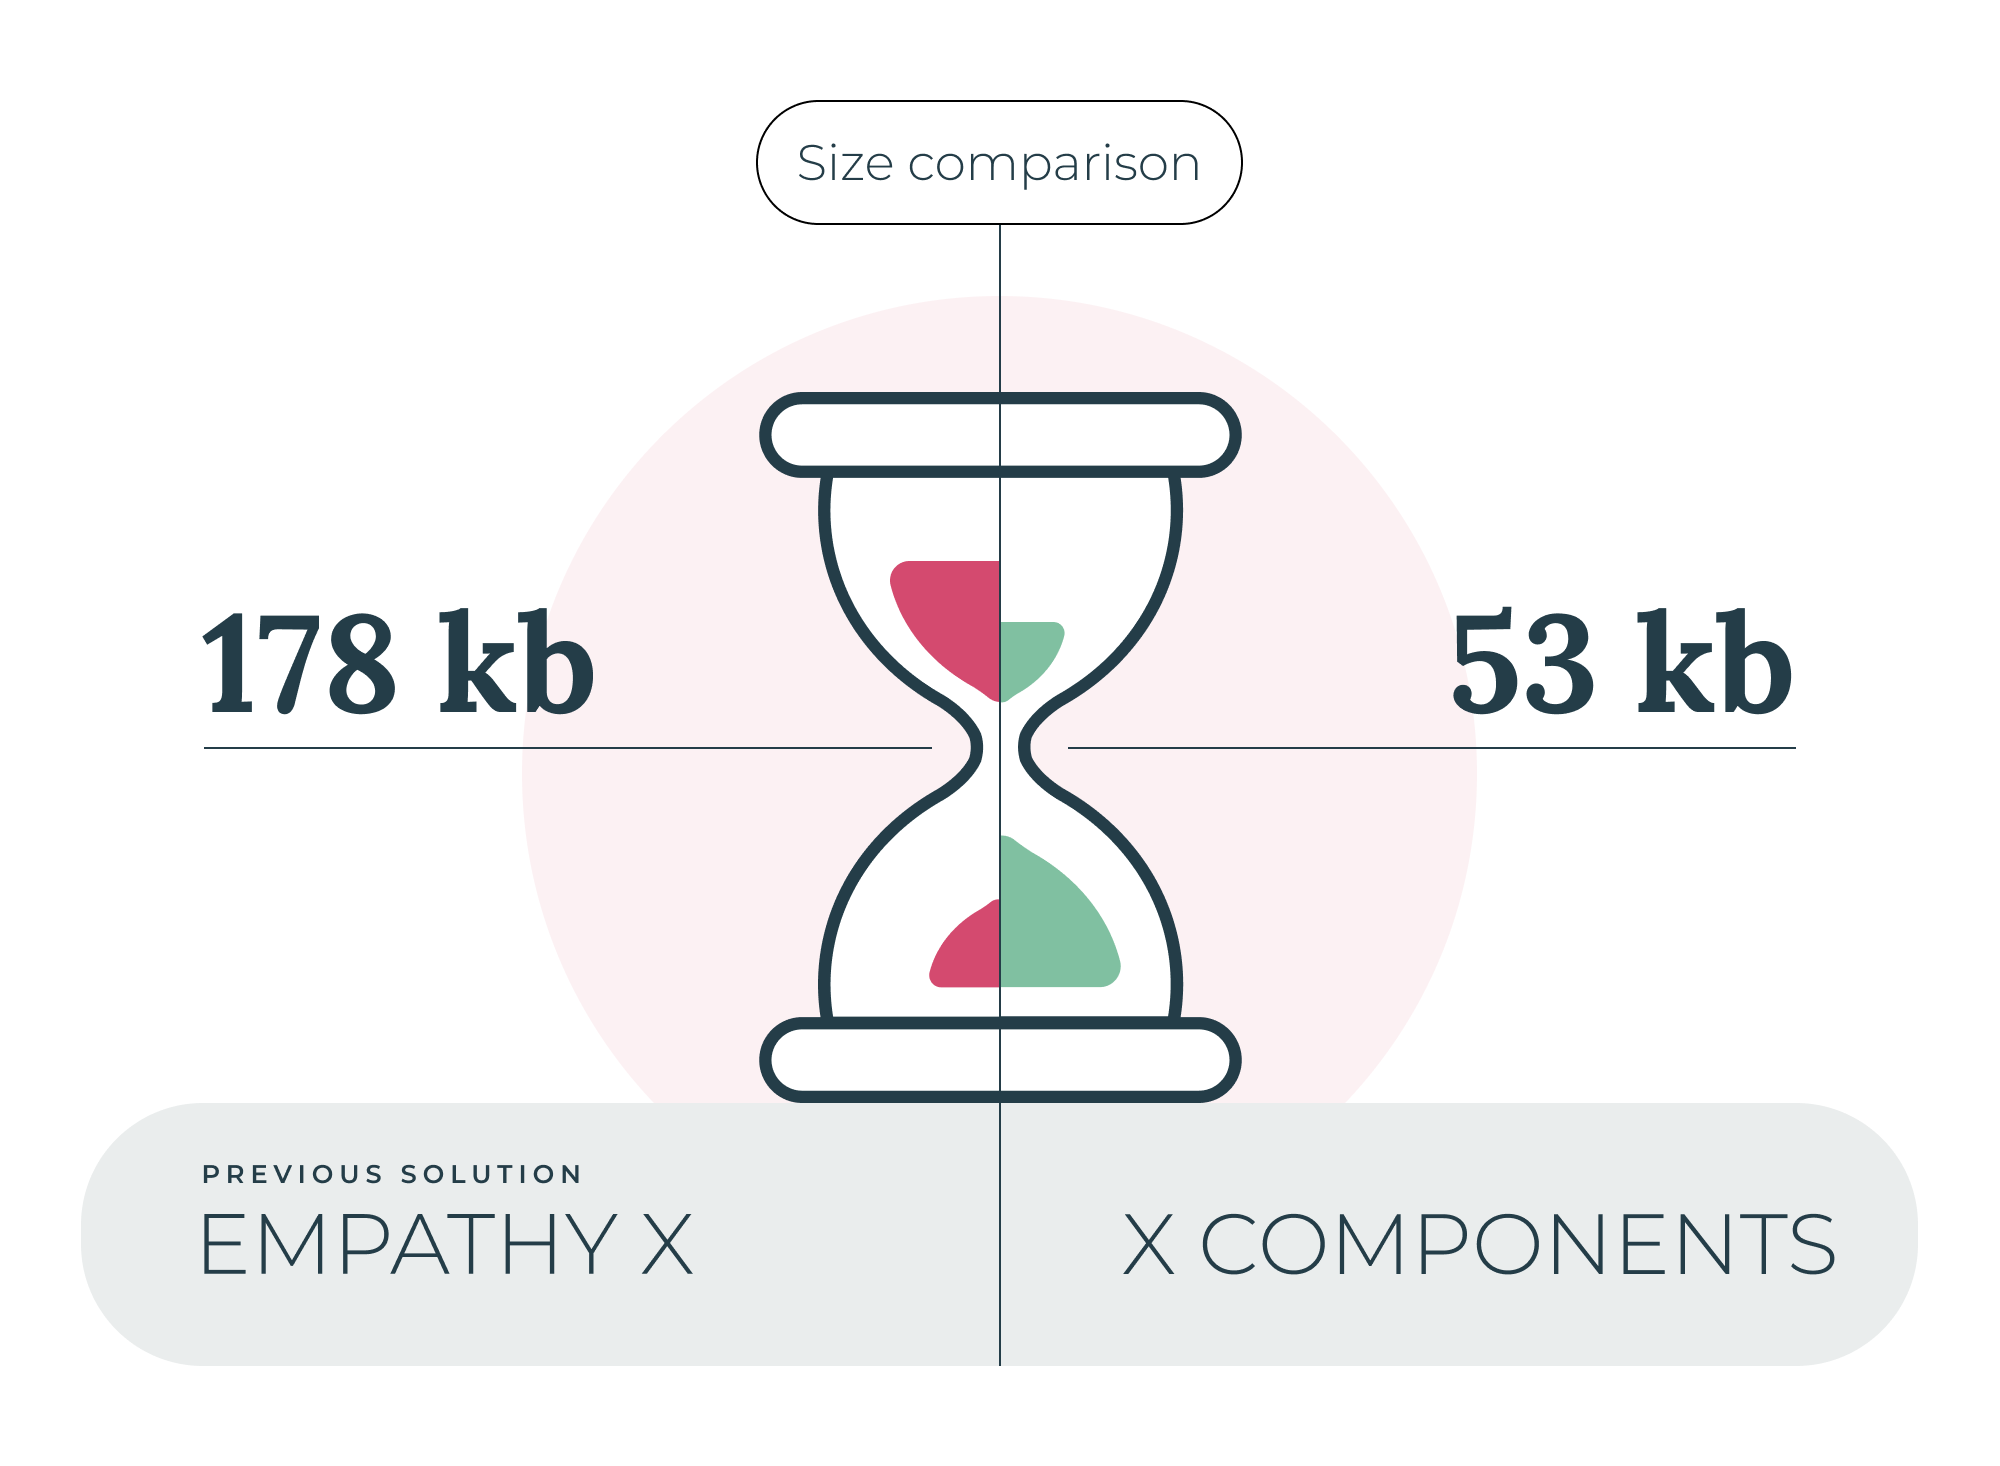
One of the most significant ways a library affects speed is its weight. More weight means longer download times and more waiting time for applications to start working. Compared to our previous solution, X Components reduced the size of the main download by up to 70% through tree-shaking, dynamic imports, and a better code structure.
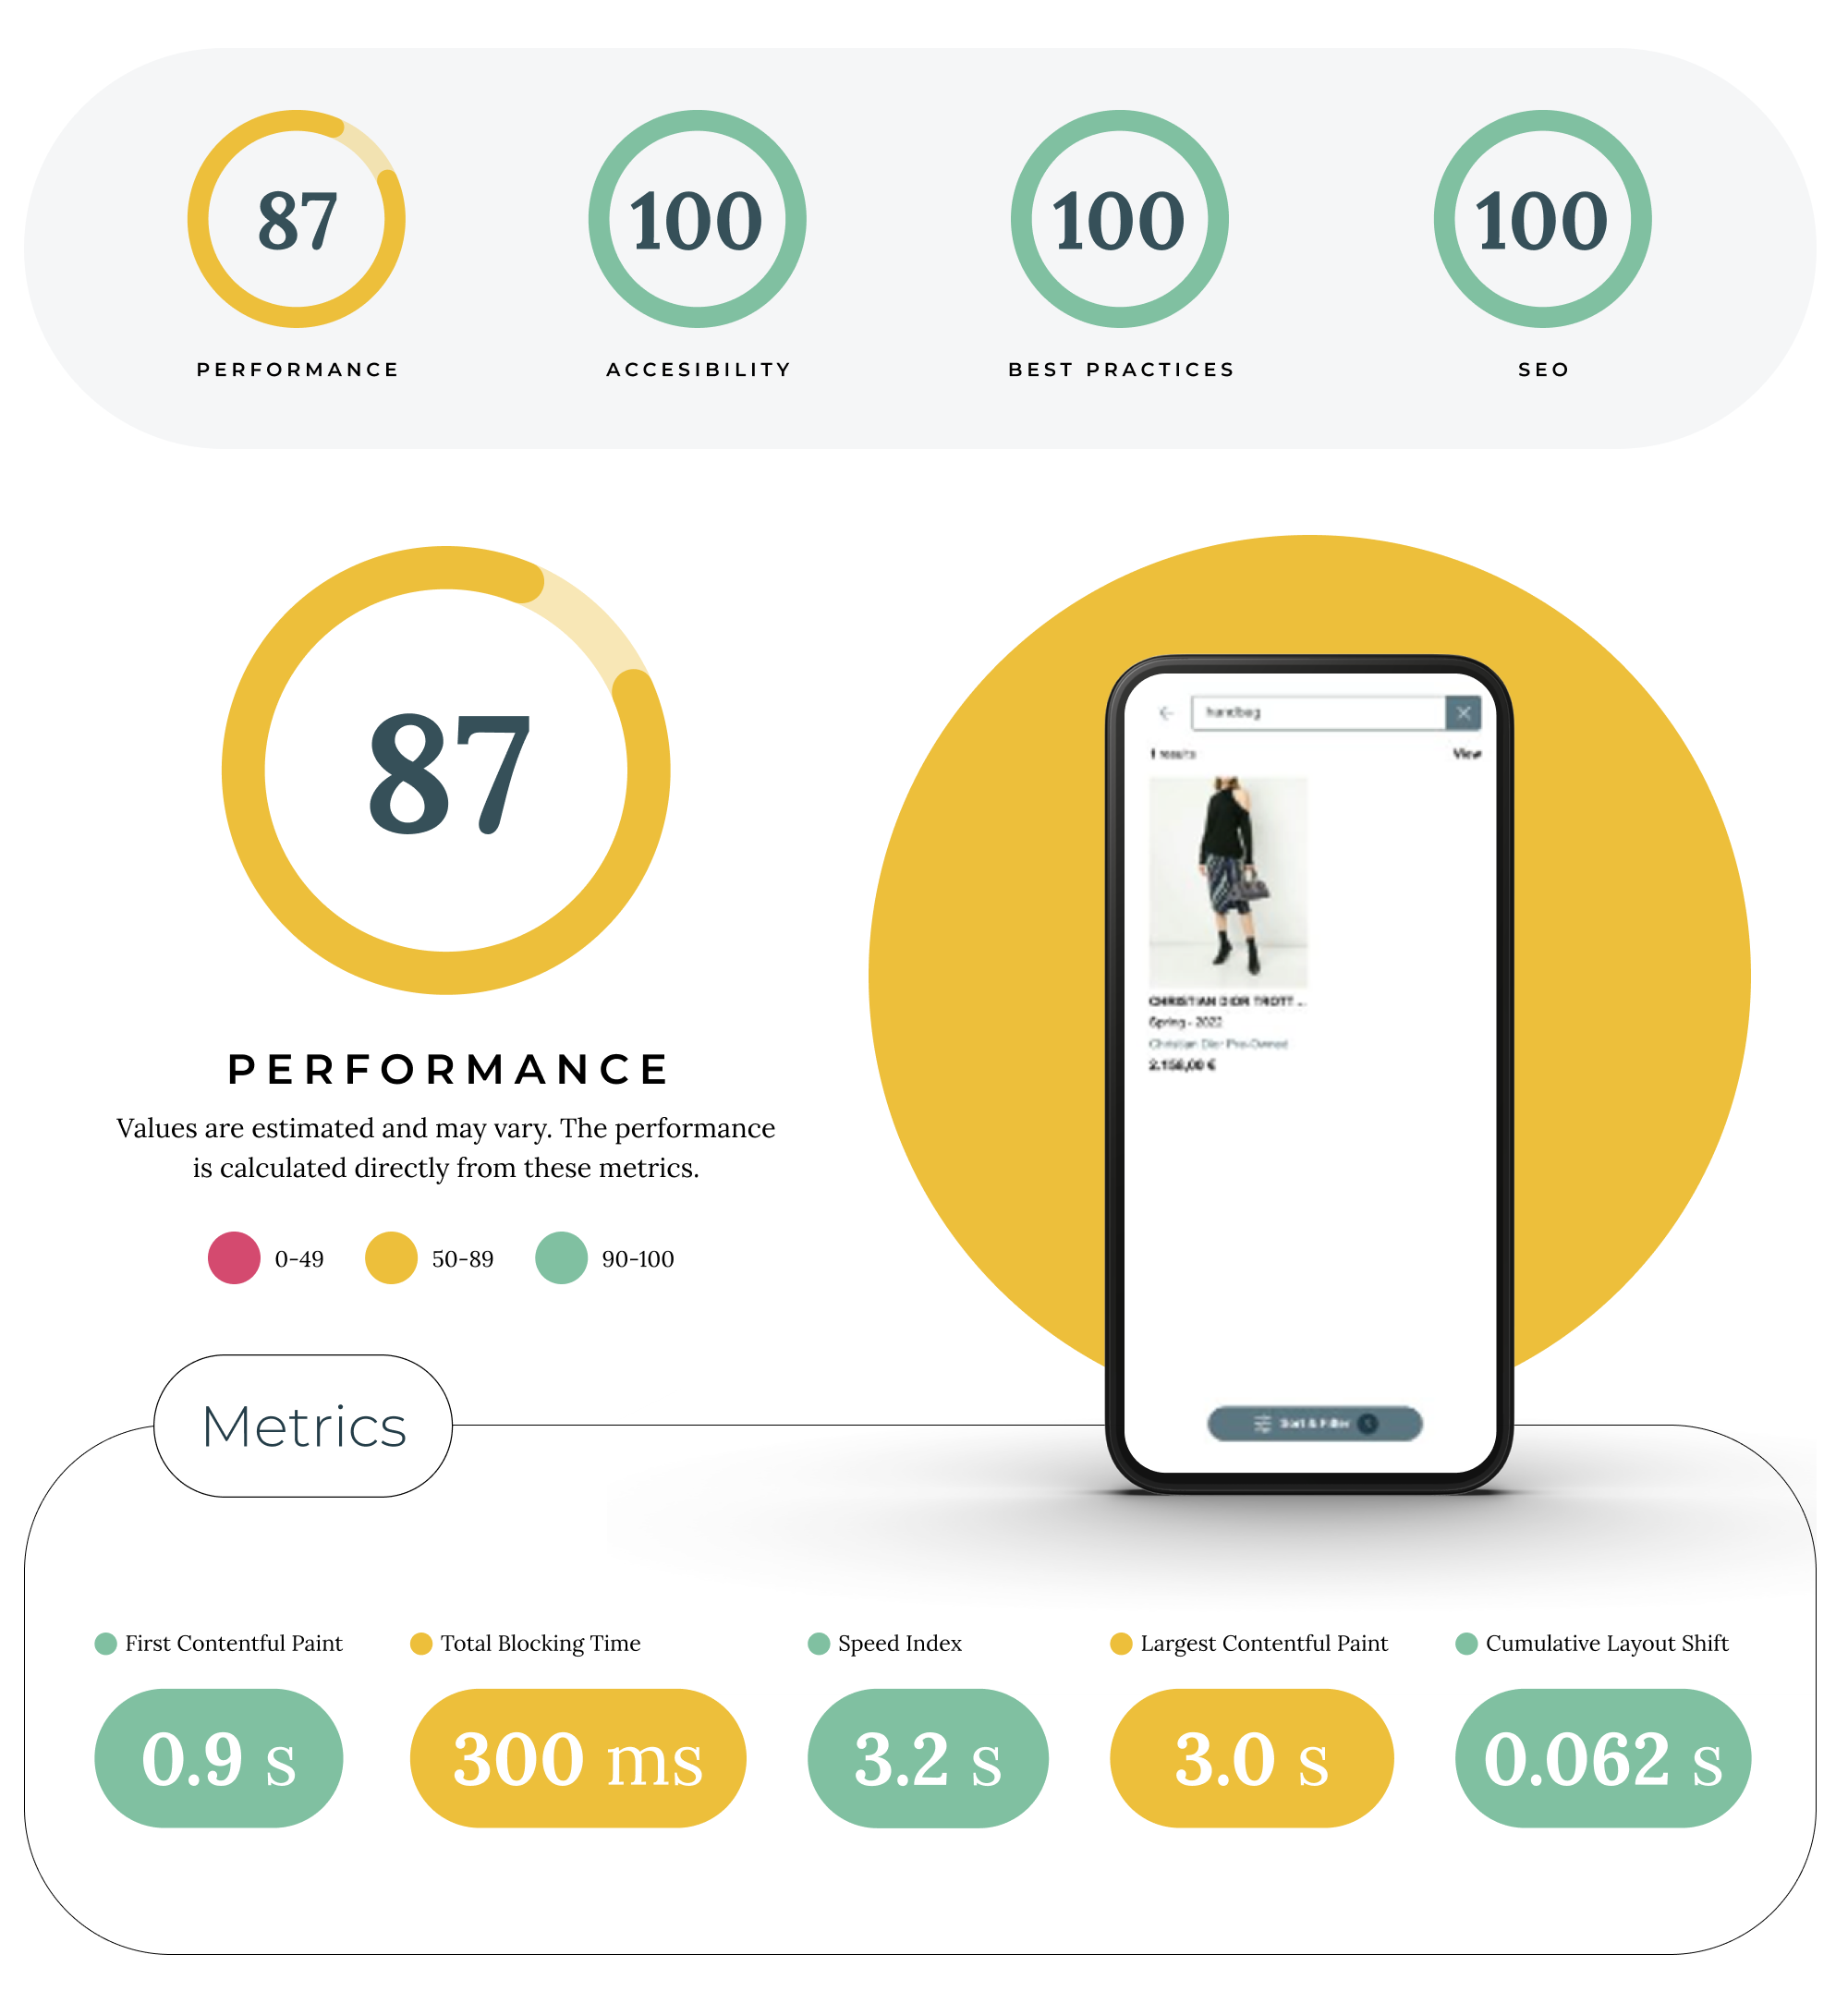
To evaluate the performance impact of our library, we created a tailored website to isolate the relevant code. This approach allowed us to clearly see how the library affected performance. Both the old solution and X Components scored around 90 in accessibility, best practices, and SEO, so we focused on the performance metric.
Key performance metrics
In terms of performance, X Components outperformed our previous solution by about 30 points, with scores dipping into the 90s in some test runs. As these test cases were not real websites, we relied on Lighthouse metrics rather than Core Web Vitals.
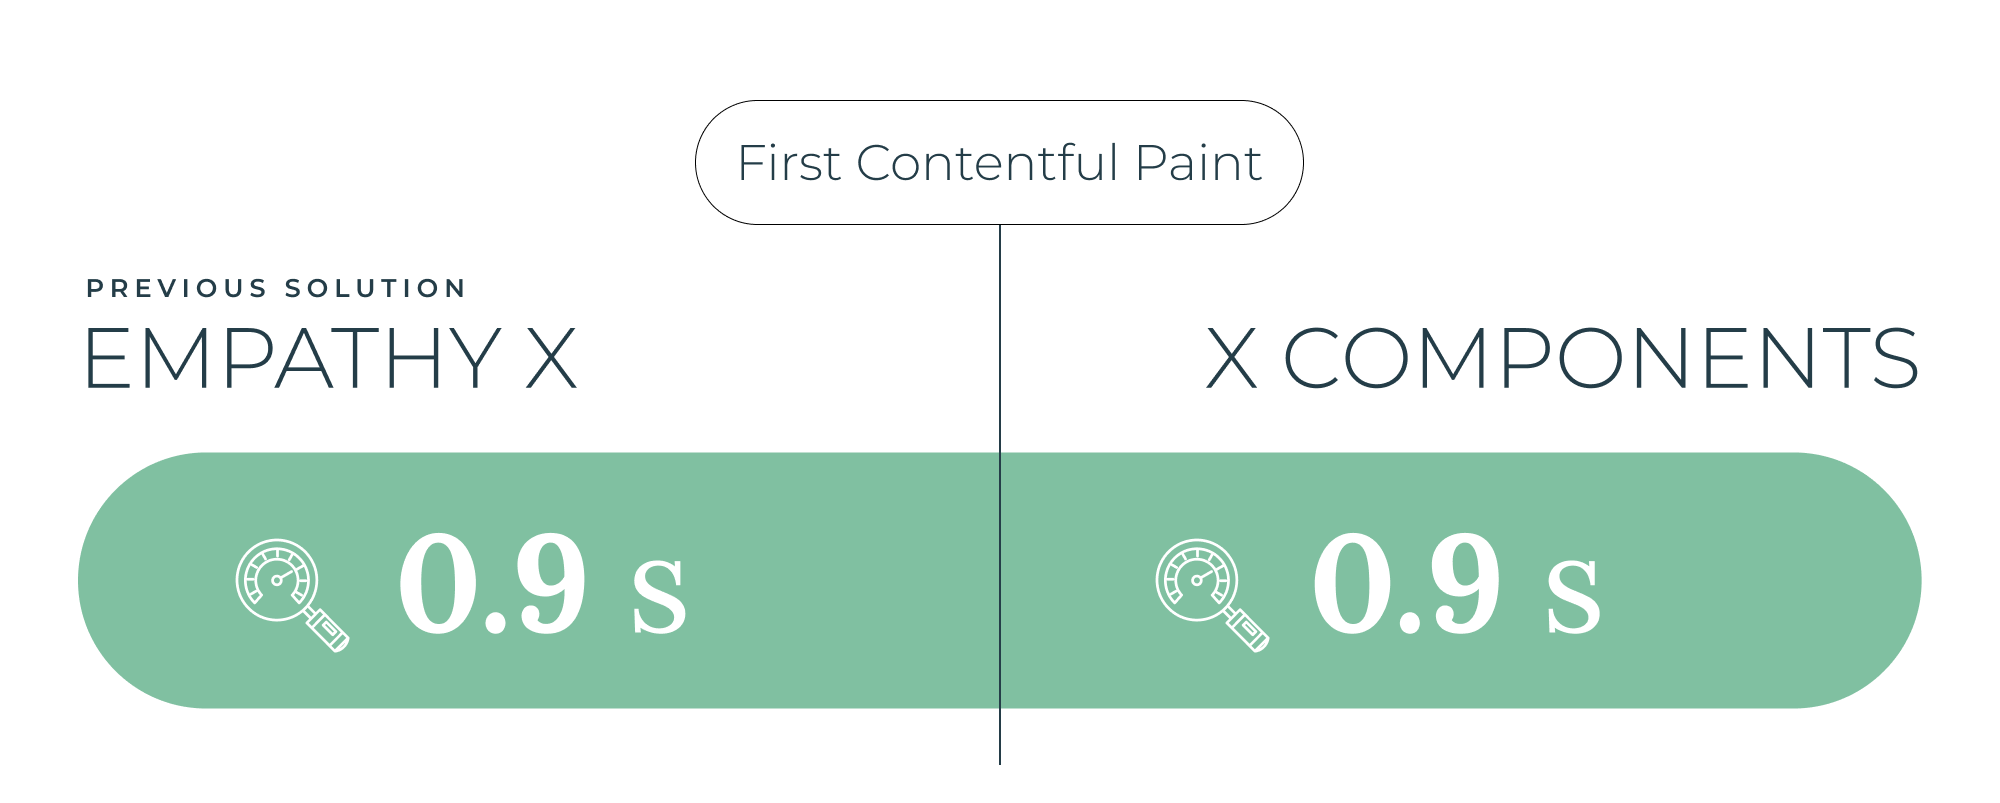
First contentful paint
This metric marks when the first text or image is painted on the screen. For our study, it was irrelevant as it represents an element of the base webpage before the library script is requested.
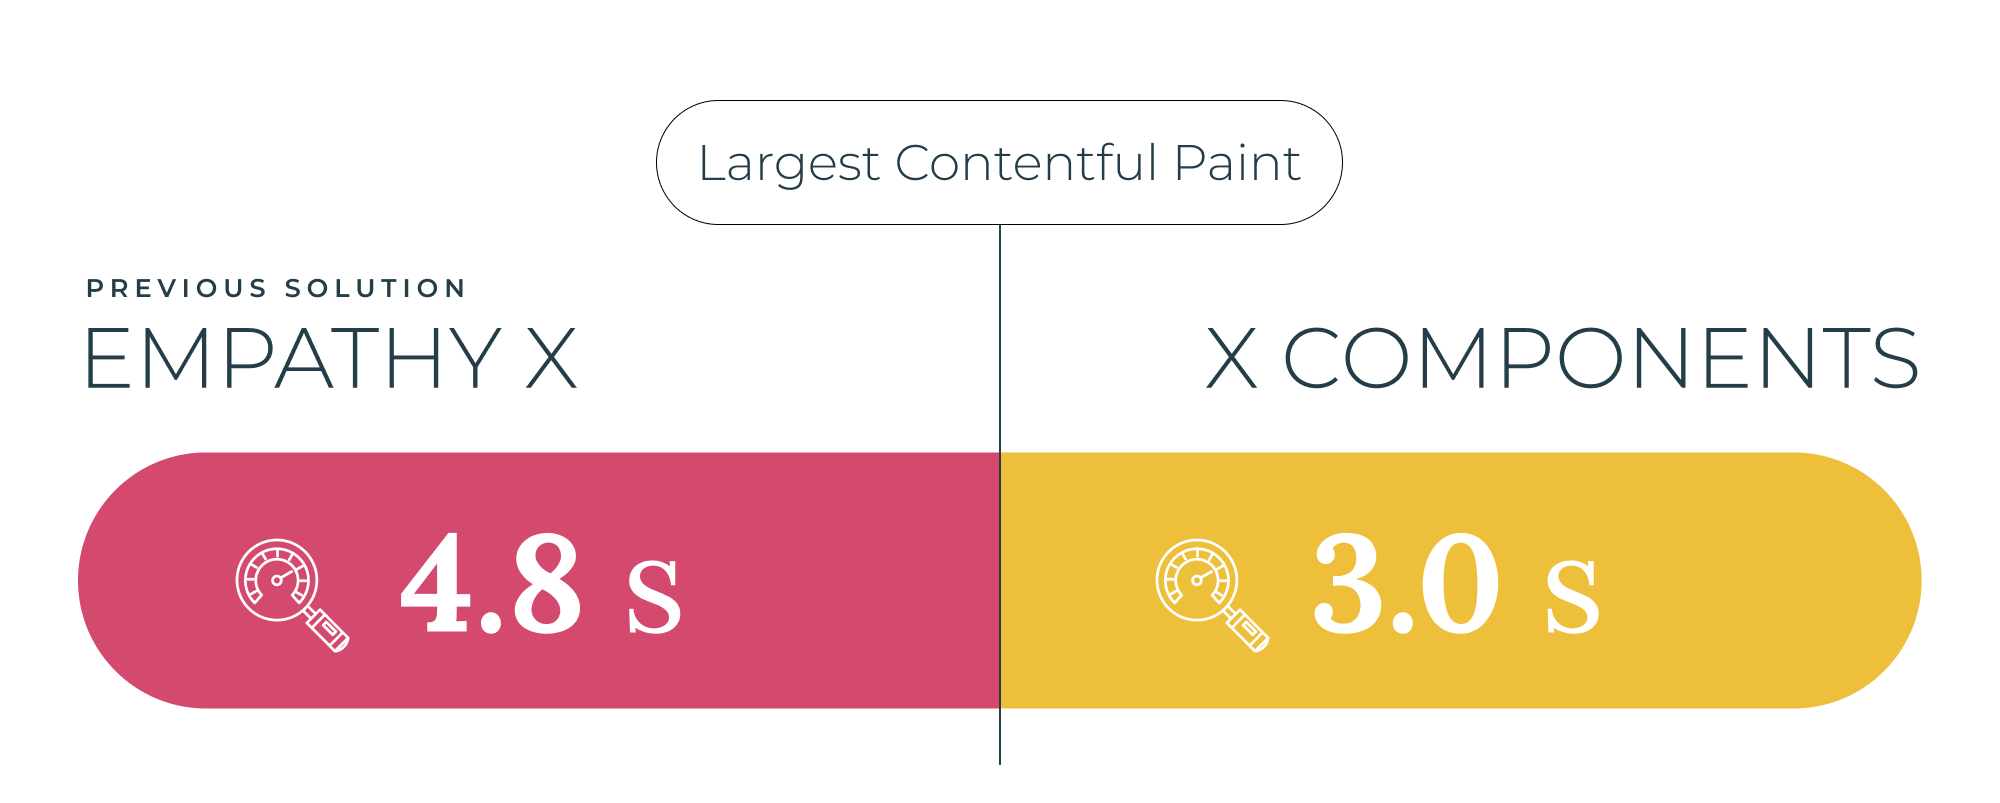
Largest contentful paint
Largest contentful paint (LCP) measures the time it takes for the largest content element to appear on a webpage. For X Components, this typically refers to the time it takes for a product image to appear when loading from a URL. Despite encompassing various processes, X Components improved our previous solution by more than two seconds, achieving 3.0s.
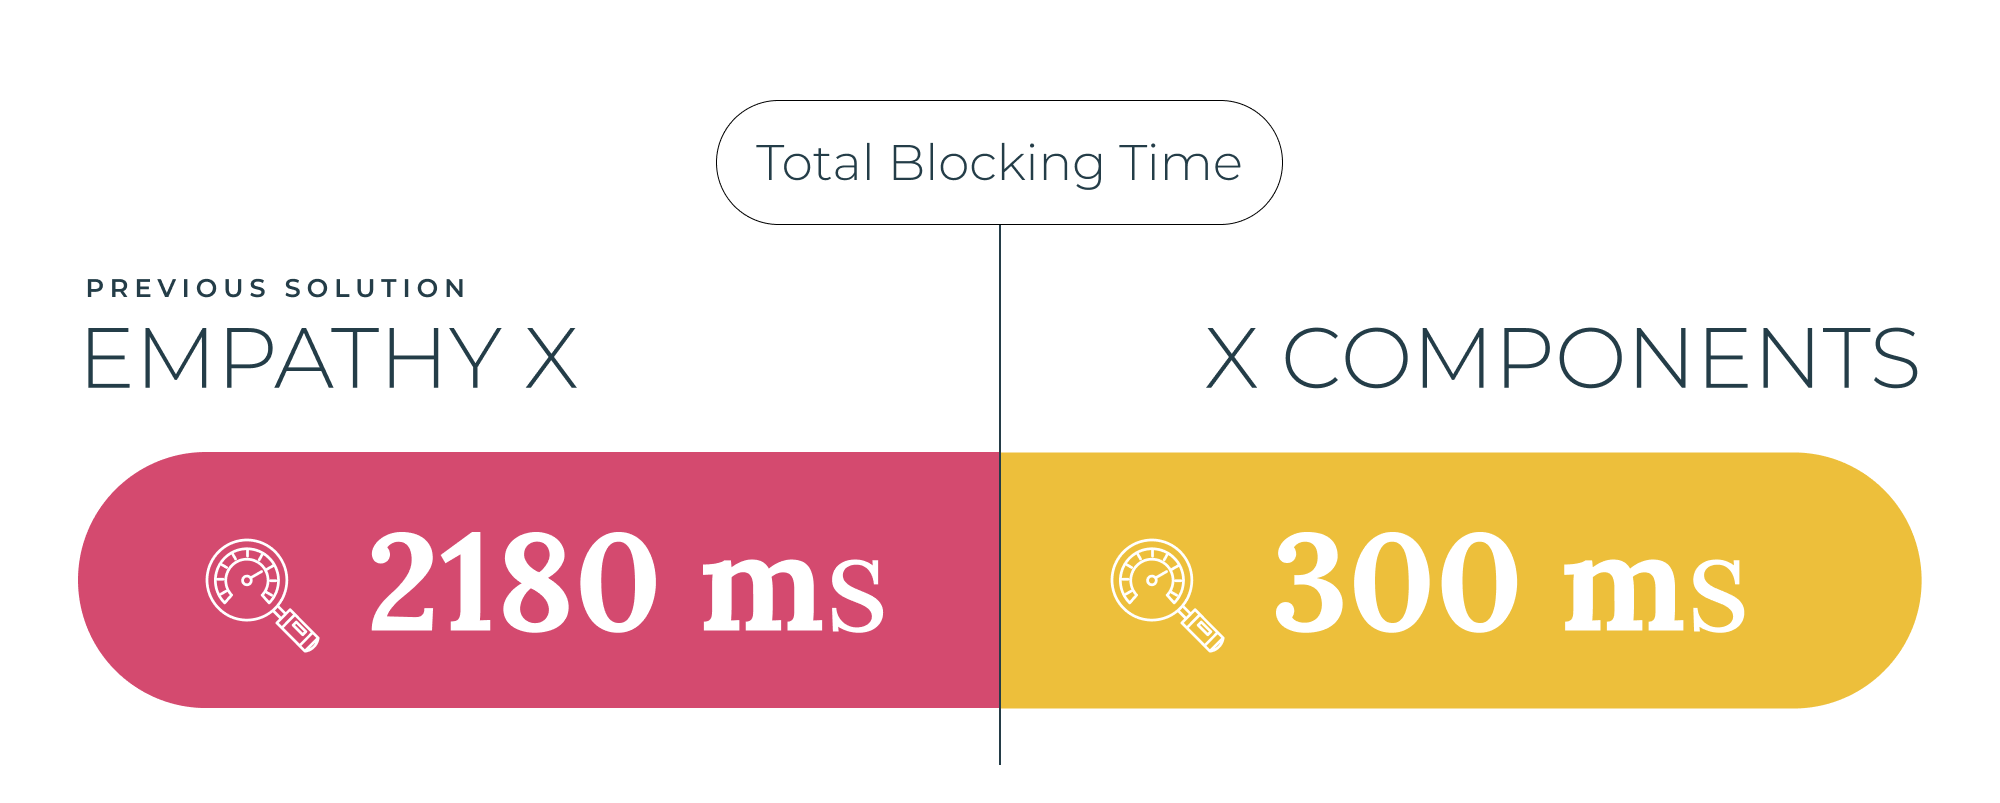
Total blocking time
This metric measures how long a webpage remains non-interactive due to heavy tasks. X Components excelled here, reducing the total blocking time by up to 2000ms, with an average of 300ms.
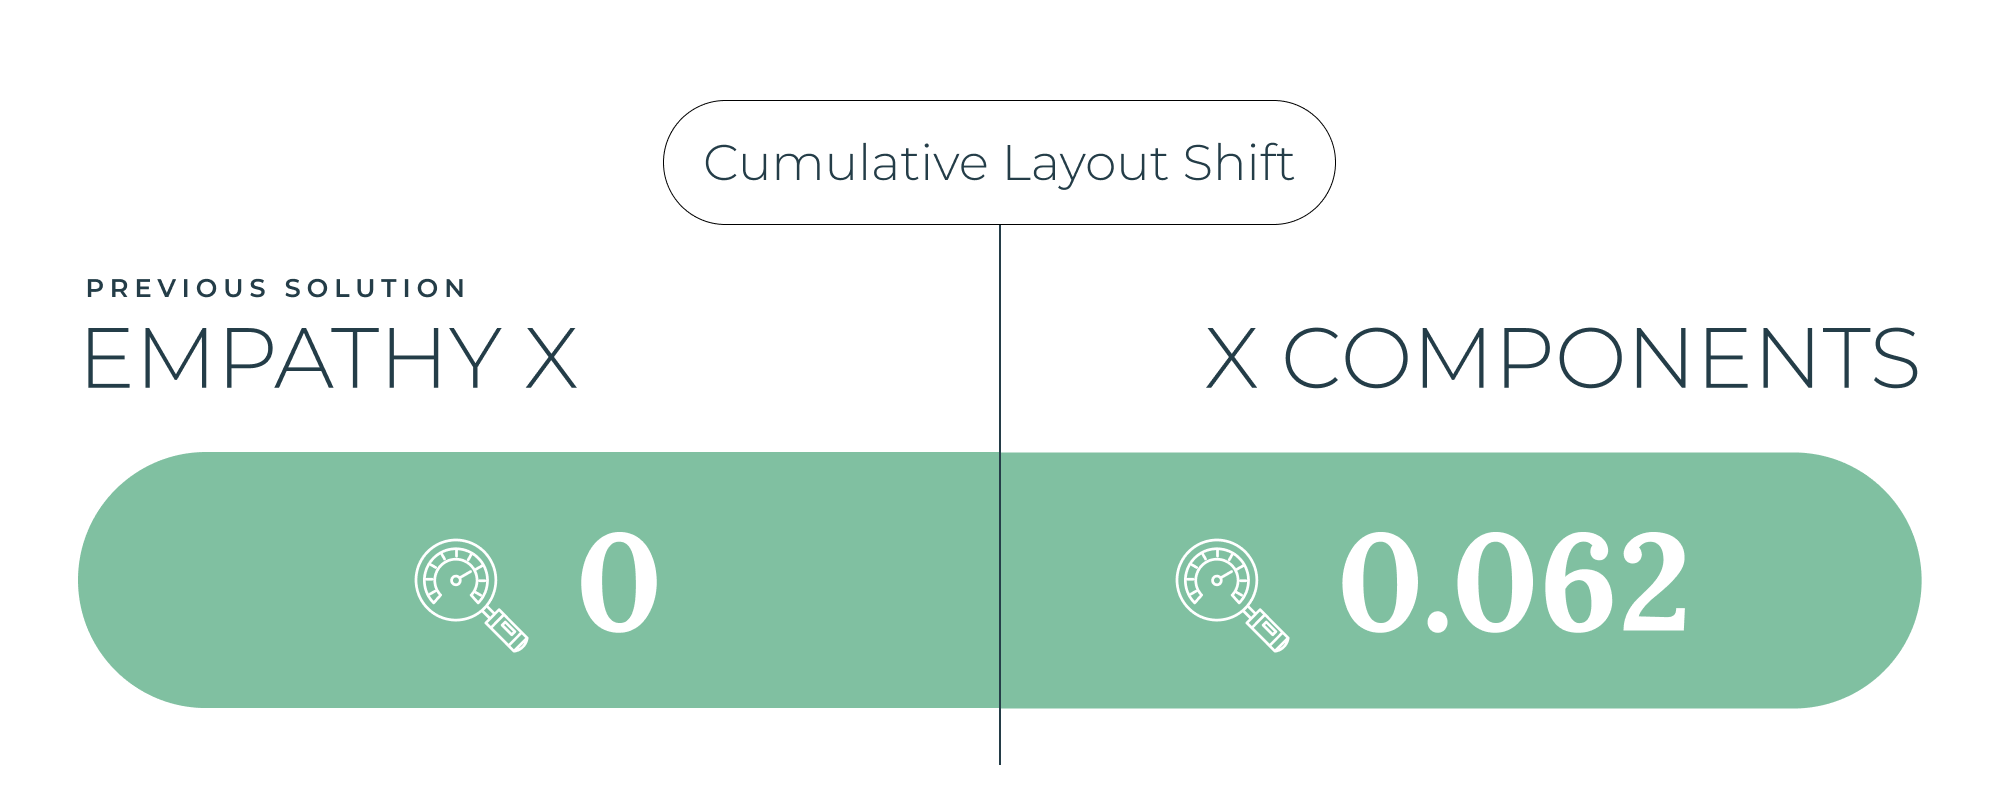
Cumulative layout shift
This user-centric metric measures the overall reshaping of the page. Both solutions performed well here, scoring 0 or very close to it.
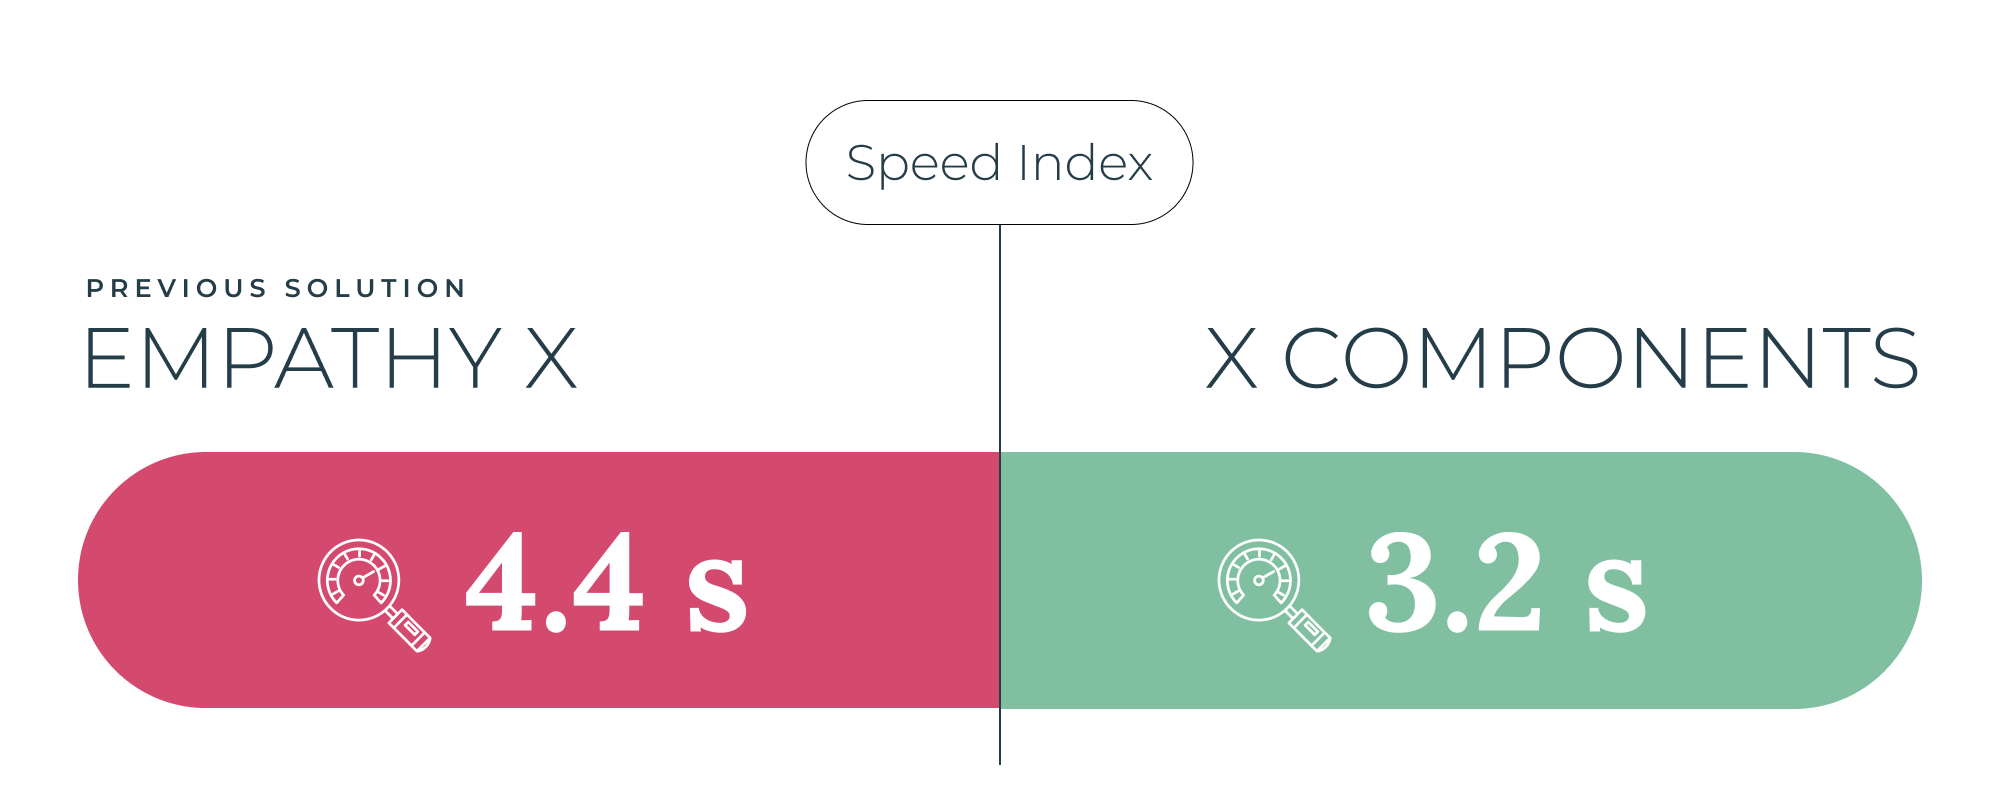
Speed index
Speed Index evaluates how quickly visual content is displayed during page load. Despite the challenges of measuring the specific impact of an external library on this metric, X Components keeps it in the green with 3.2s, over 1 second faster than our previous solution.
The impact of X Components
The X Components library significantly enhances performance by minimizing its impact on various fronts. It starts with reducing the initial load size using modern techniques like tree-shaking and dynamic importing. The library also minimizes the clogging of the main processing thread, bringing it down to nearly zero.
This focus on constant improvement results in a clean, lean HTML, and CSS structure, free of abrupt layout shifts. The processes of fetching and displaying search results are streamlined, minimizing the potential impact of the library code on the search experience speed.
These improvements have led to a 60% reduction in bounce rate on low-end smartphones and a 0% bounce rate due to performance on desktops.
However, outside the library, the most significant performance hindrances in the tested search experience are the necessary requests for the search function, particularly the images of the results.
Performance optimization is a continuous process, especially when dealing with external libraries and user perceptions of speed and satisfaction. Developing X Components with a constant focus on reducing performance impact ensures that it remains a net positive for the search experience.